Economic indicators are key numbers about the economy of any country that can help you better understand where the economy is headed. These indicators can help investors decide when to buy and sell investments. For example, if the stock market is at its peak, you may want to sell. If the market is low and on the rise, you may want to buy. Economic indicators can help you understand this variation and trend of the market, as well as other important financial factors. If you’d rather have a more hands-off approach and let a expert take these indicators into account.
Types of Economic Indicators
Economic indicators come in multiple groups or categories. Most economic indicators come with a specific schedule for release and can be helpful in the right circumstance. Here are the three important types of economic indicators that we can group most into.
Leading Indicators: Leading indicators point to future changes in the economy. They are extremely useful for short-term predictions of economic developments because they usually change before the economy changes.
Lagging Indicators: Lagging indicators usually come after the economy changes. They are generally most helpful when used to confirm specific patterns. You can make economic predictions based on the patterns, but lagging indicators cannot be used to directly predict economic change.
Coincident Indicators: Coincident indicators provide valuable information about the current state of the economy within a particular area because they happen at the same time as the changes they signal.
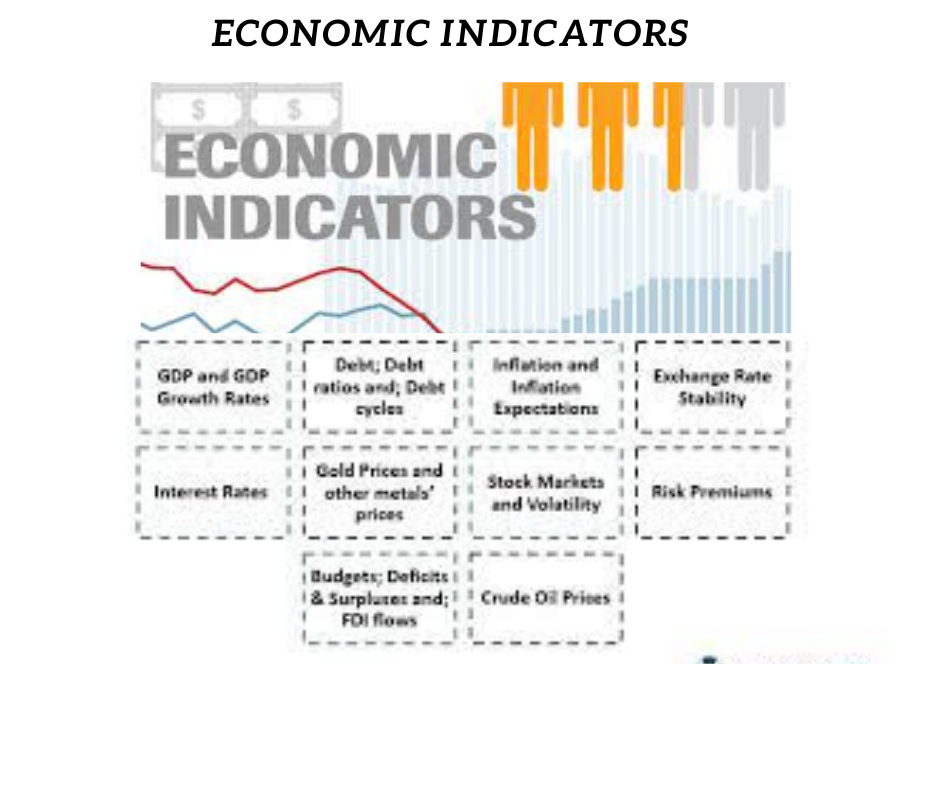
Economic Indicators and their Uses:
There are numerous economic indicators that are gathered into the three types listed above. Each one can help investors, economists and financial analysts to make smart financial decisions. Below we cover some of the most important indicators that you might find helpful, depending on what you’re wanting to predict or plan for.
Gross Domestic Product (GDP):
GDP is a lagging indicator. It is one of the first indicators used to measure the health of an economy. It represents economic production and growth, or the size of the economy. Measuring GDP can be complicated, but there are two basic ways to measure it.
One measurement is the income approach. This approach adds up what everyone earned in a year, including gross profits for non-incorporated and incorporated firms, taxes less any subsidies and total compensation to employees. The other approach is the expenditure method. This method adds up what everyone spent in a year, including total consumption, government spending, net exports and investments. The results of these two measurements should be roughly the same. However, the expenditure method is the more common approach because it includes consumer spending, which accounts for the majority of a country’s GDP.
GDP is usually expressed in comparison to the previous quarter or year. For example, if the GDP of a country is up 3% in 2020, the economy of that country has grown 3% since the previous measurement of GDP in 2019. Annual GDP figures are often considered the best indicators of the size of the economy. Economists use two different types of GDP when measuring a country’s economy. Real GDP is adjusted for inflation, while nominal GDP is not adjusted for inflation.
An increase in GDP indicates that businesses are making more money. It also suggests an increase in the standard of living for people in that country. If GDP decreases, then it suggests the reverse. The market’s responses to GDP shifts may also depend upon how one quarterly GDP measure compares to prior quarters, as well as how it compares to economists’ expectations for that current quarter.
The Stock Market:
The stock market is an important indicator. It is also the indicator that most people look to first, even though it is not the most important indicator.
Stock prices are partially based on what companies are expected to earn. If companies’ earnings estimates are accurate, the stock market can indicate the economy’s direction. For example, a down market could indicate that overall company earnings are expected to decrease and the economy could be headed towards a depression. On the other hand, an upmarket could suggest that earnings estimates are up and therefore the economy as a whole may be thriving.
The stock market is not necessarily an accurate leading indicator. Earning estimates could be wrong, and the stock market is vulnerable to manipulation. Wall Street corporations and traders can manipulate numbers to inflate stocks via complex financial derivative strategies, high-volume trades and creative accounting principles. (Wall Street’s version of creative accounting is not always legal.)
In addition, the government and Federal Reserve have used federal stimulus money and other strategies to keep markets high in order to avoid public panic in the event of an economic crisis. Since the market is vulnerable to manipulation, a stock or index price is not essentially an accurate reflection of its value.
There are also stock market bubbles, which can give a false positive for the economy’s direction. If investors ignore underlying economic indicators, and there are unsupported increases in price levels, a market crash could happen.
Unemployment:
Unemployment is a lagging indicator. The unemployment rate is determined through a monthly survey of thousands of households. It estimates the proportion of country’s who were unemployed during the period when the survey was taken. The unemployment rate only reflects people who are unemployed and looking for work.
The non-farm payrolls represent the total number of workers employed by any country’s businesses, other than general government employees, workers in private households, employees of non-profit organizations that provide assistance to individuals and farm workers.
The number of jobs created or lost in a month is an indicator of economic health and can significantly impact the securities markets. When more businesses are hiring, it suggests that businesses are performing well. More hiring can also lead to predictions that more people will have more money to spend since more of them are employed.
If unemployment rates rise unexpectedly or decline less than expected, that can sometimes be associated with a drop in stock prices as it may suggest that employers cannot afford to hire as many people. Remember, how an economic indicator comes in relative to expectations is very important. (Continued to next Part)

The writer is having vast experience in Banking and Finance sector for over one and half decade, where during his period of work he has experienced different economic and development initiatives taken for the wellbeing of the public masses through the banking channel.
He has worked for the Microfinance banks which are offering community based services among the under developed segment of the society.
The major work done in Financial Inclusion where several hundreds of people were brought to Banking channel to improve their businesses.
The under served segment of society like woman were given the chances to change their lives through credit facilities to grow their home based businesses which is also an imitative of Women Empowerment.
The Writer has also worked against different social issues and highlighting them for positive change in the society through public awareness and their active involvement to reach to the solution.
This journey of empowering people is on going and is never lasting till the time last person remains underserved.